Connecting the CSR spend 2015-16 to the………..Big picture
Cordial Greetings!
This month we chose to write an editorial on “Connecting the CSR spend 2015-16 to the….Big Picture”. It covers the contributions of Corporates & PSU towards Education which forms part of the larger pool of money spent by the government, social returns on education, & the need to monitor the appropriate social indicators to evaluate quality Education to enable India achieve the SDG goal 2030 for Education.
[wp_table id=4024/]
* Data for 2014-15 is as per MCA clarification received on 31 March 2016. (Source – Govt of India – MCA, Rajya Sabha Q&A)
# Analysis of 50 companies by SoStakes.
In 2014-15, Corporates and PSU’s spent Rs. 6338 Cr in various sectors under Sch VII of the Companies Act. In comparison, in 2015-16, 50 companies including Corporates and PSU’s have spent Rs.5365 Cr. (against a CSR Budget of Rs.5918 Cr).
Hence in 2015-16, 10% of the companies have spent almost the full amount of CSR spend of the previous year.
An amount of Rs. 553 Cr was unutilized by the 50 companies. We note that some of the Corporates, as per their Annual Reports, have transferred large sums to their foundations. In some cases we find that the money in the foundation has not been utilized. So while the company is compliant under the Companies Act, would this be termed as good financial engineering and making use of loopholes in the law? The unutilized amount could, potentially, be higher than Rs. 553 Cr. It may not be long before MCA comes up with guidelines mandating that money transferred to foundations also needs to be utilized in the same year.
Having said this, here is an analysis of how the CSR money was spent and the sectors that have benefited.
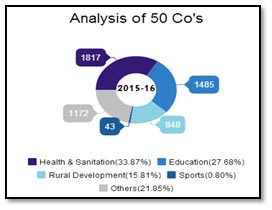
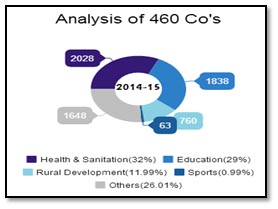
Fig 1:- Total CSR Spend of 460 companies is 6638 Fig 2:-Total CSR Spend of 50 companies is Rs.5365 Cr
We feel that there are inefficiencies in the sectoral analysis and comparison over the last year since the allocation and classification is not standard across companies. This is particularly noticeable in the classification between health, education and rural development that seems to be interchangeable amongst corporates. For example, some health projects such as sanitation and hygiene (WASH programmes) conducted in rural areas has been classified as Rural Development while the same program in urban India is termed as a “Health Project”. Even the education sector suffers from the same anomaly. And, some other companies working in rural areas have classified women empowerment/livelihood programs as skill development instead of rural development etc.
Health & Sanitation sector receives Rs. 1817 Cr, followed by Education Rs. 1485 Cr, Rural development sector Rs.848 Cr and Sports at Rs.43 Cr.
Health, Education & Rural Development comprises of 78% of the CSR Budget
The CSR spend on the Health and Sanitation sector is Rs 1817 Cr. The funds were spent in setting up mobile medical service camps in rural areas, construction of labs/rooms / wards in hospitals and construction of toilets for schools under Swacch Bharat. Corporates have also donated equipment such as X-ray machines & Ultra sound machines, etc.
The next big spend was Rs. 1485 Cr on the Education sector. A large part of the spend was on infrastructure ranging from building classrooms, toilets to playgrounds. Small portions of the funds were spent on capacity building of teachers. Technology companies pioneered pilot projects using ICT. It is worth mentioning here that corporates like Wipro have supported interventions such as curriculum development and teacher capacity building on a pan India basis.
Post the Olympics and reviewing India’s performance there, a lot was discussed around CSR spend on Sports. In 2015-16, Rs. 43 Cr was spent on sports. As per Sch VII, CSR on sports included training to rural sports, Paralympics and Olympics. Post Olympics 2016, there has been a request to include creation /maintenance/ up gradation of sport infrastructure, setting up gymnasiums etc under Sch VII. This augurs well for the sports fraternity, which has long been deprived of basic infrastructural needs, leave alone financial support.

As the contribution to the education sector is large, we would like to examine education spends in India.
Fig 3: – Total amount towards Education sector is Rs 72,394 Cr (Sarva Shiksha Abhiyan (SSA); Rastrya Madyam Shiksha Abiyan (RMSA); Rastrya Uchchatar Siksha Abhiyan (RUSA).
[wp_table id=4071/]
About 3.7% of the total budget and 0.6% of the GDP is allocated for education. This is a far cry from the 6% of GDP that had been recommended by the UN. We not only allocate less than the developed nations such as the U.S. (5.2%), U.K. (5.8%), Japan (3.8%) and Australia (4.9%) but also lag behind under developed countries like Brazil (6.3%), Ghana (8.1%), Indonesia (3.6%) and Pakistan (2.5%).
*Adjusted GDP at constant (2011-12) prices; GDP 2015- 135760 Bn (unadjusted amount) Source: indiabudget.nic.in/budget.asp
Numbers and allocation of budgets is only one aspect and we can endlessly debate as to what should be the appropriate allocation. However, it is of vital importance that the government puts in place appropriate indicators which measure education inputs, quality and achievement rather than the current indicators such as enrolment ratio and teacher /pupil ratio etc. The need of the hour is to have a budget allocation for monitoring. Using Big Data analytics and superior survey tools for monitoring, we can get far more nuanced measures of the education process and outcomes at all levels.
That education is a form of investment is now a well-established and widely accepted idea. Like other investments it is natural to ask whether or not the benefits from education are worth the costs.
Various independent studies, suggest that social benefits of investing in education are high but the ranking of return by level of education is sensitive to a countries’ economic context: Low-income countries benefit more from investments in primary education; in middle-income countries secondary education brings in higher social returns while in the high-income countries, it is the higher education that yields the best returns.
Each additional year of education is associated with 13% higher GDP per capita1. Empirical evidence suggests the median of social returns in Asia are 19.9 % for Primary education, 13.3 % for secondary education and 11.7% for higher education.2
SDG 4: Universal education of good quality for all and opportunities for learning throughout life.
The importance of education cannot be undermined. We must act with a sense of heightened urgency, and with long term commitment. The new SDG agenda requires all of us to reflect upon the ultimate purpose of learning throughout life. Because, if done right, education has the power like none else to nurture, empower, reflect and engage citizens who can chart the way towards a safer, greener and fairer planet for all.
References:-
- The investment case for Education and Equity. ( study by UNICEF)
- The full social return on education (study by world bank)